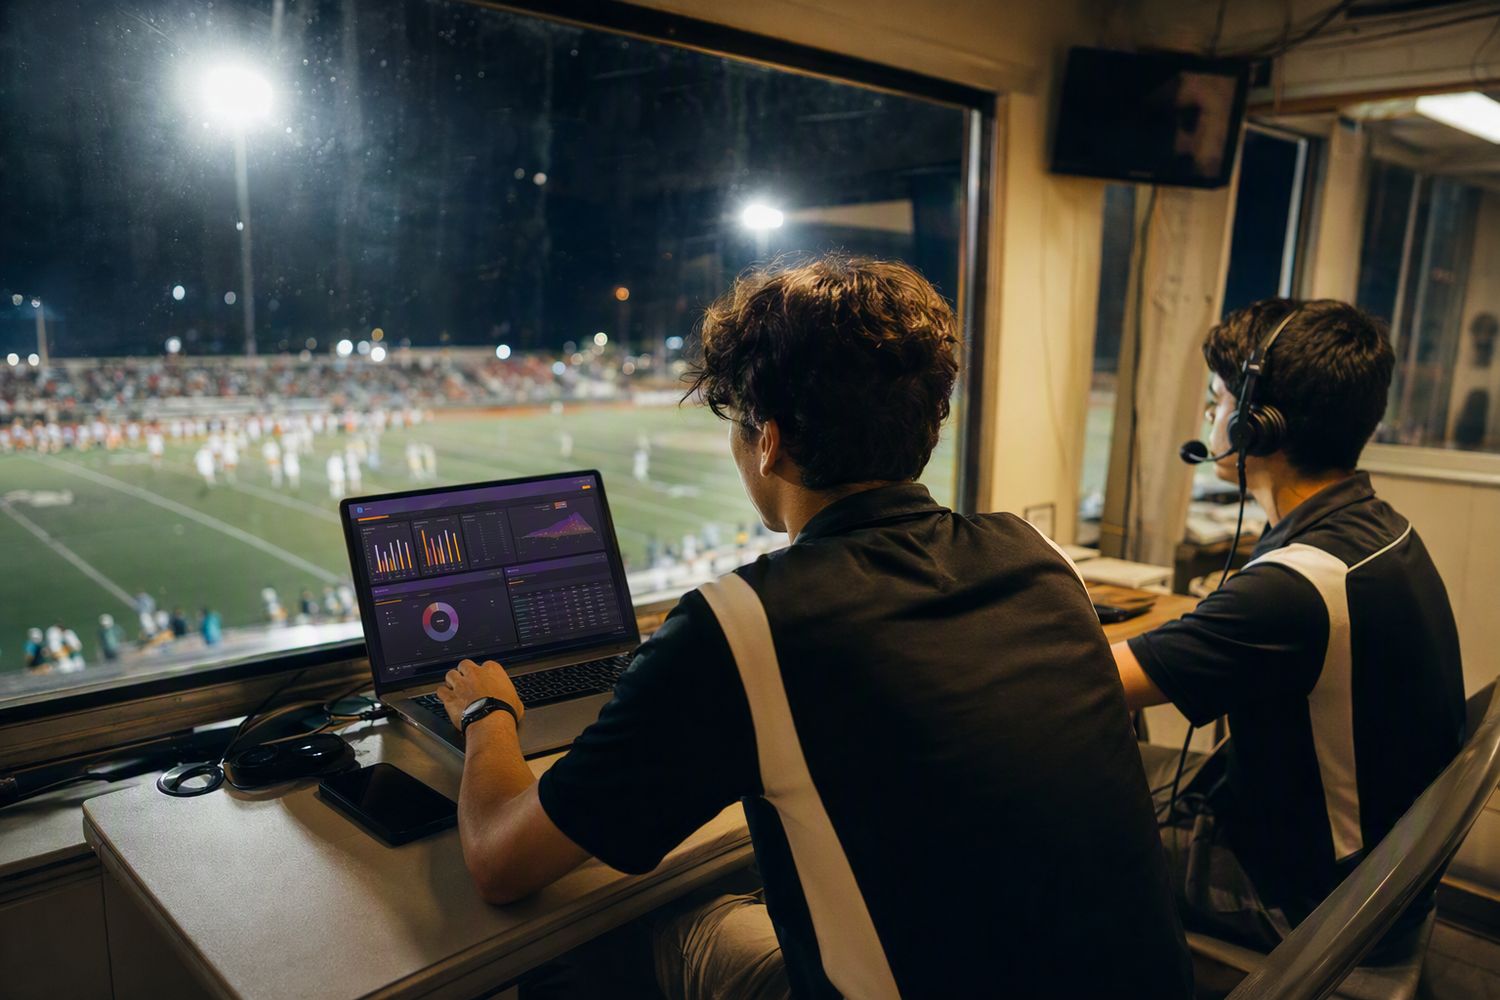
One laptop in the press box runs the whole night. Coaches get a
live field chart on the sideline, the broadcast gets real-time graphics, the stadium
board gets the score — and the season totals are already banked
before the team is off the field.
Play type, players involved, result, where the ball ended up on a
drag-and-drop field, yards. Your spotter never types a stat line — they just
describe what happened, and the engine does the rest.
Offense, defense and special teams all in the same flow — the buttons
change with possession.
Penalties and two-point tries move the ball correctly without polluting
anybody's stat line.
Undo on every play, and a passcode lock so a curious hand can't rewrite
the third quarter.
Nothing to install. It is one HTML file. Open it and go.
Two students, one laptop, the whole night's data.
02 — Box Coach
The field, drive by drive.
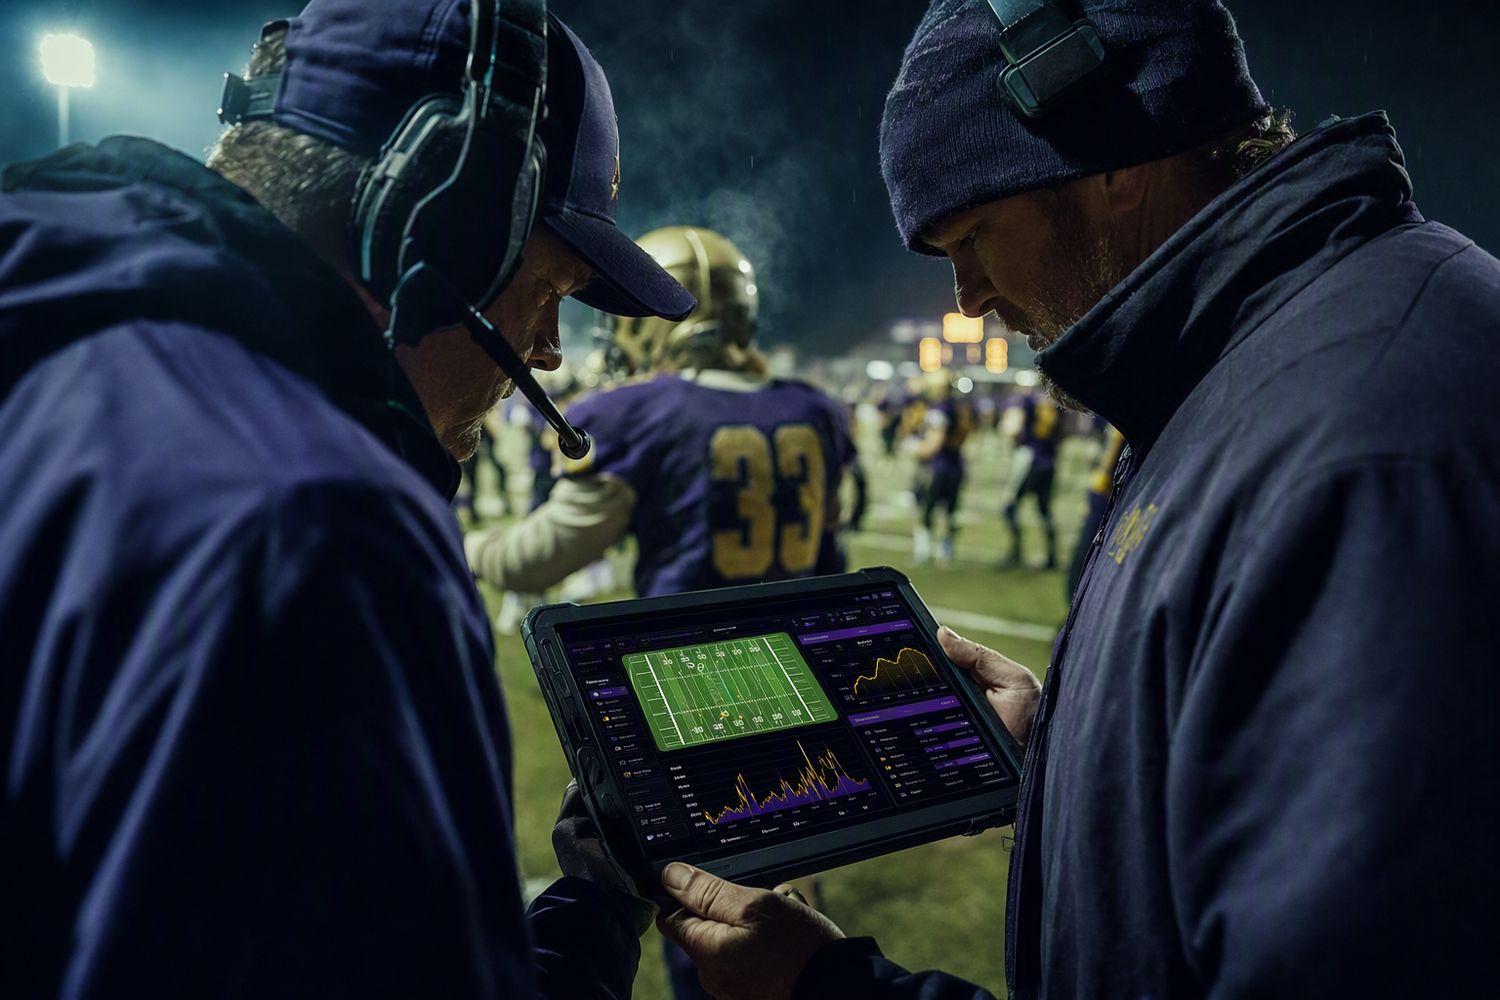
Coaches open one address on an iPad. Every snap is drawn where it
actually happened — the dot is the spot, the far end is where the play died.
Green run, blue pass, gold touchdown, red for lost ground.
10.0.1.24:3000/boxcoach.html
Q2 · 01:0410 – 72nd & 8Mustangs Ball
RunsPassesTouchdownsSacksPenaltiesTurnovers
RunPassTouchdownLost yardsPenaltyTurnover
Next call · 2nd & 8 at our 46
Throw it
Second and 8. Runs 3.9 a carry, throws 10.5 a throw. Second down has been going for 12 a play.
Q1
Touchdown
our 25
6
75 yds
Q1
Defensive Series
our 38
3
—
Q1
Turnover
our 29
3
2 yds
Q2
Defensive Series
our 34
2
—
Q2
Field Goal
our 48
5
24 yds
Q2
Defensive Series
our 36
1
—
Q2
In Progress
our 32
3
14 yds
The throw game is the edge
Throws are going for 10.5 against 3.9 on the ground, and are getting the down 63% of the time.
3 explosive plays
Plays of 15 yards or more. They are 19% of your snaps and usually the difference in the score.
The defence is living in the backfield
2 plays behind the line from 6 defensive snaps logged.
This is not a mock-up. The field above, the
suggested call and the drive list were rendered by the product's own code from a real
24-play half — 16 offensive snaps, 8 runs averaging 3.9,
8 throws averaging 10.5. Change the game and every word of it changes.
🏈
What's working
Run against pass, broken down by down and by area of the field. Third-down
conversion, explosive plays, plays that lost ground, and who is actually
producing.
💡
The next call
A suggestion for the down, distance and field position on the board right now,
with the reasoning shown. Under six snaps it says so instead of guessing.
📱
Built for a thumb
Touch-sized controls, a Whole Game / 2nd Half / This Drive filter, and no
pinching. It refreshes itself — nothing to press.
Sideline, third quarter. The numbers are already on the tablet.
03 — On the sideline
A second opinion from the numbers.
Box Coach knows what has worked tonight. It does not know your game
plan, your personnel, or what you saw on film — so it never pretends to. Every
claim it makes traces back to a snap your spotter logged.
It says when it doesn't know. Fewer than six offensive snaps and it tells
you that, rather than reading noise.
It knows whose ball it is. On defense it stops suggesting offensive plays
and reads out the front seven instead.
Every insight is traceable — the plays behind it are one tab away.
04 — Broadcast & scoreboard
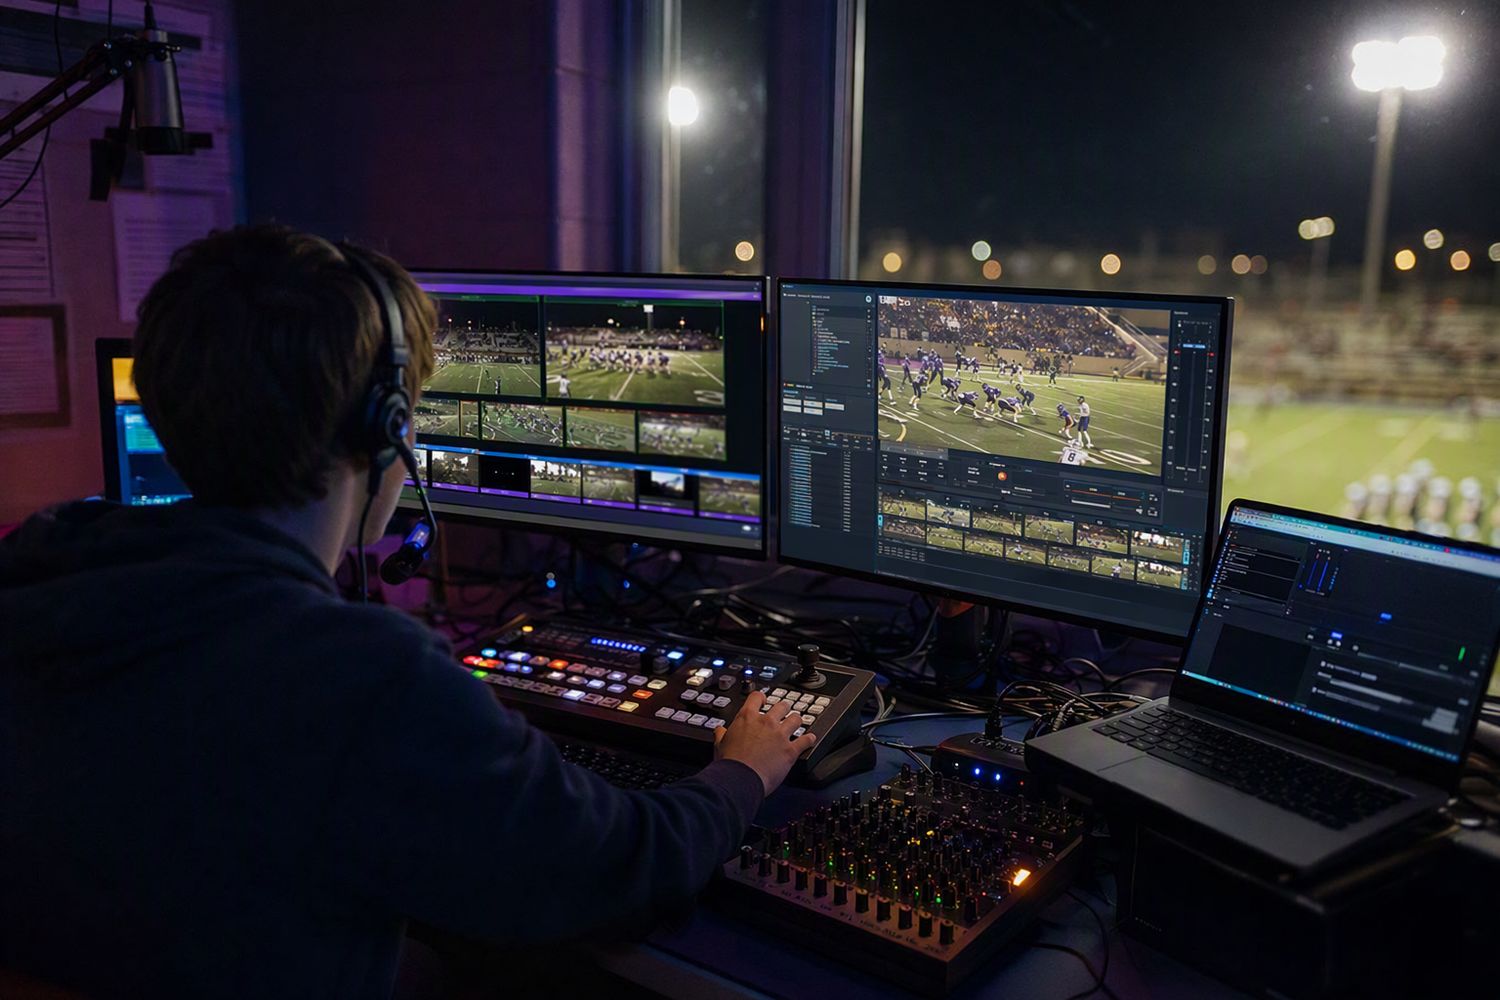
It talks to the gear you already own.
The server publishes plain CSV and JSON on your own network. Point vMix
— or anything that reads a URL — straight at it. Column positions never
move between versions, so a mapping you built last season still works.
Pulls from the scoreboard. Clock, quarter, score, down, distance and
possession arrive on their own, about four times a second.
Possession drives the tracker. When the board flips to the visitors, the
stat entry flips to defense automatically.
Quarter-by-quarter linescore worked out by watching the score change
— no extra work for the board operator.
Jersey-indexed lookups so a third-party graphics package can grab row 24
and actually get number 24.
Graphics update themselves. Nobody retypes a score.
05 — Migration
Bring the rest of your season with you.
You will not run the press box for every game — away trips happen,
and somebody else keeps the book. Hand SnapCount the PDF they send and it reads the
box score itself.
STEP 01
Drop in the PDF
The stat sheet from your existing service, exactly as it arrives. No export
step, no spreadsheet, no retyping.
STEP 02
It reads the box score
Rushing, passing, receiving, kicking, returns and the full defensive table —
mapped onto the same stat columns your graphics already use.
STEP 03
You check the matches
Every player it found, with the stats it read, and a drop-down on each row.
Two brothers with one surname never get merged.
STEP 04
Banked to the season
One button. Season totals only — the game on screen is untouched. Import
the same sheet twice and it warns you.
Reading happens
on your own machine. No upload, no account, no service to sign up for —
the PDF never leaves the building.
Friday night doesn't wait for a spreadsheet.
Neither should your stats.
06 — The suite
Five screens, one laptop.
Everyone on the same data at the same moment. Share one link and the
whole staff picks the view they need.
✍
Stat Tracker
The press box tool. Play-by-play entry, roster, season totals, the away-game
import and the passcode lock.
one HTML file
🏈
Box Coach
The field chart, what's working, the next call and every drive — built for
an iPad on the sideline.
/boxcoach.html
📋
Coach View
Pick any player and watch their line update live. Filter by offense, defense or
special teams, game or season.
/coach
🎤
Commentator Board
Leaders in passing, rushing, receiving, all-purpose, tackles, sacks, takeaways
and scoring — ready to read on air.
/commentator
📺
Stadium Big Screen
The public-facing board. Score, clock, situation and the last play, sized for the
back row.
/public
📡
Broadcast Feeds
Seven CSV feeds and six JSON endpoints on your own network, with column
positions that never move.
vMix ready
07 — Built to be trusted
It runs when the Wi-Fi doesn't.
🔒
Nothing leaves the building
No cloud account, no subscription, no student data uploaded anywhere. The server
runs on your laptop and speaks only to your own network.
⚡
Offline by design
The tracker, the PDF reader and every viewer page work with the internet
unplugged. Press box Wi-Fi is not a dependency.
✅
1,166 automated checks
Every stat rule, every CSV column, every field coordinate is covered by tests
that run before a release ships.
Ready for Friday
Put the whole night on one screen.
Unzip it, double-click the server, open the tracker. You can be
logging plays in about five minutes — and the coaches can watch from the sideline
on the first drive.